
Quickstart: Creating a report
Use Reports to monitor performance across Projects, Campaigns, Teams, and Agents — with default KPIs or custom KPIs that match your business needs.
Before you start
- You need the appropriate access rights to view reports (data is visible only for users/teams/campaigns you have permissions for)
- Clarify what data you want to track: overall performance, campaign efficiency, agent metrics, lead-level results, etc.
- An in-depth guide to the Reports module can be found here.
Step-by-step
1. Navigate to Reports
- From the main menu, go to Insights > Reports
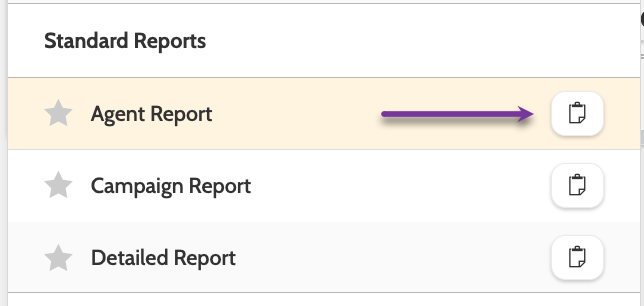
- You’ll see a list of existing reports. Reports are grouped into two sections: My Reports (custom reports you create), and 3 pre-configured Standard Reports.
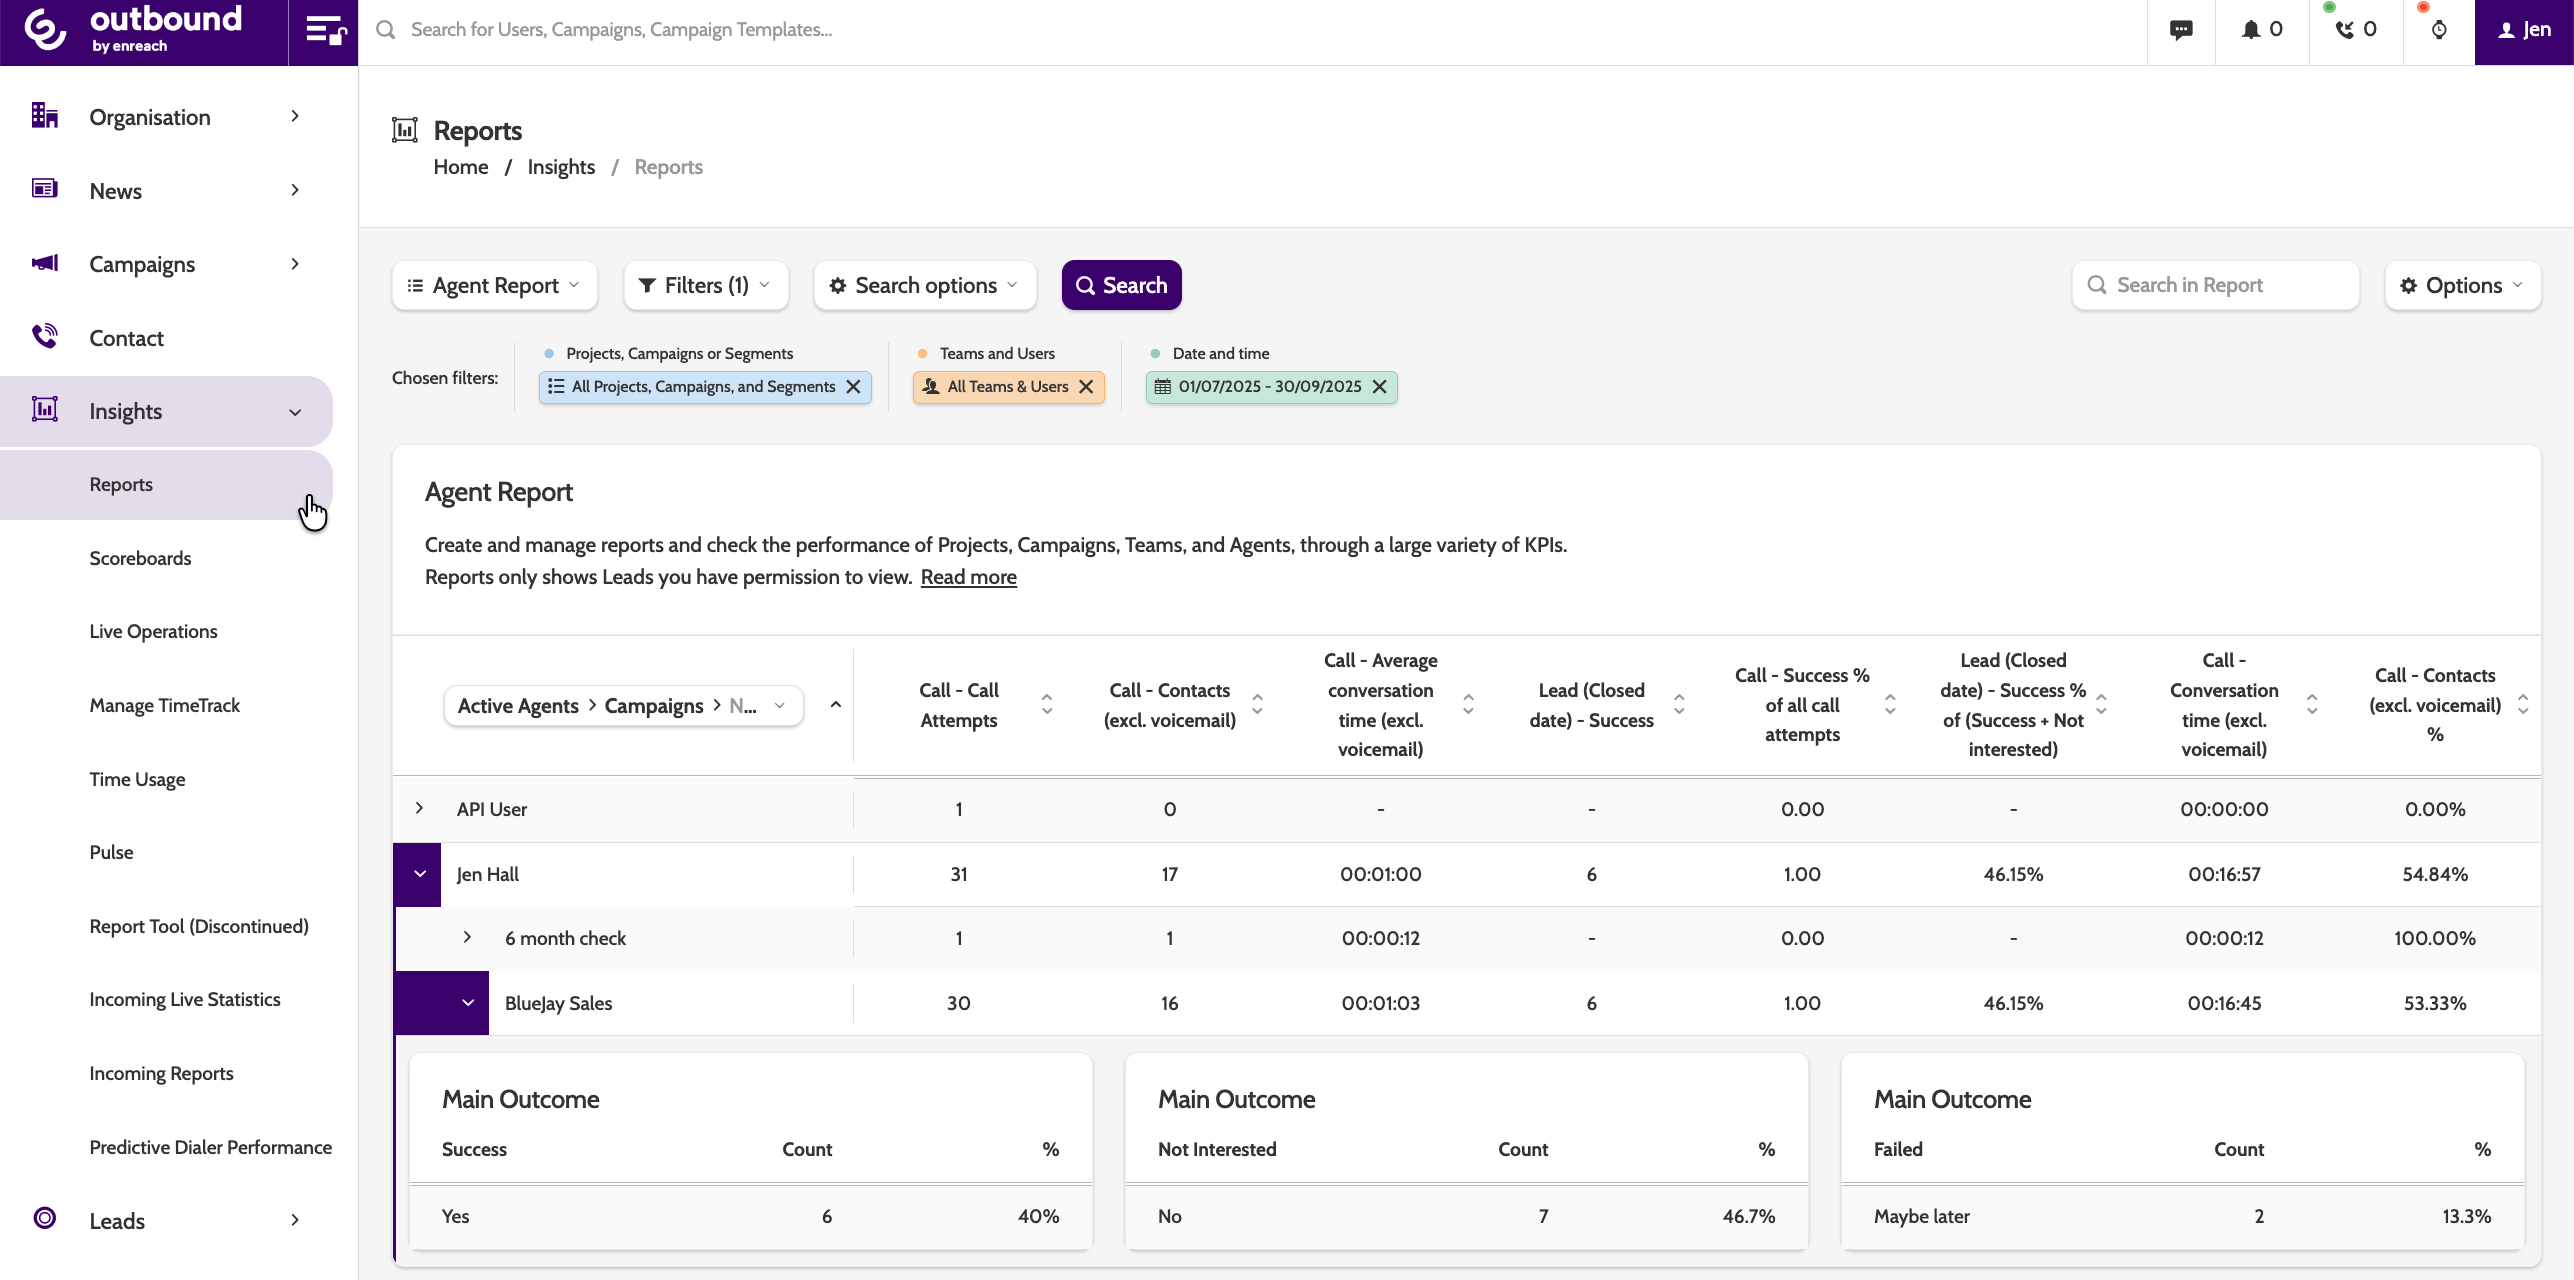
2. View a Standard Report
- Open the reports dropdown and select one of the default reports: Agent, Campaign, or Detailed
- Click the date and time option to filter the report by a certain period, then click Search to load the report
- The first column shows a hierarchy such as Projects > Campaigns > Active Agents (or whichever grouping you select)
- Other columns show KPIs (e.g. calls made, success rate, etc.) by default.
You can expand or collapse hierarchical groups to dig into project-level, campaign-level, or agent-level data.
3. Create a Custom Report
Note this is only available for Advanced, Premium, and Unlimited accounts! If you'd like access the Report builder, contact your account manager.
- Start with KPIs. Click the “+” icon (Add Column) to add KPIs
- Use the Filters menu to select Projects, Campaigns, Teams, Users, or other criteria relevant to your report
- Click Search to load data matching your filters
- Click Save Report to finish
- Your report can be found under My Reports. Click the star to load it as default! ⭐️
If you want to customise a standard or existing report, simply create a clone and make your changes.
4. Build Custom KPIs
Using the KPI Builder, you can create tailored metrics based on:
- Lead Data Summarising — e.g., sum, count, or average of a given lead data field (e.g. revenue, number of leads, etc.)
- Filtered User-Processed Leads — e.g., count leads closed with a specific outcome, or filter by custom lead field values.
- Open the KPI selector and click Create KPI
- Select the KPI type, and enter the details
- When finished, click the pencil icon to give the KPI a name and click Save Changes.
Read more about the KPI Builder here
5. Save, Share or Export Reports
- Once your report is set up, click Save report as to store it under My Reports.
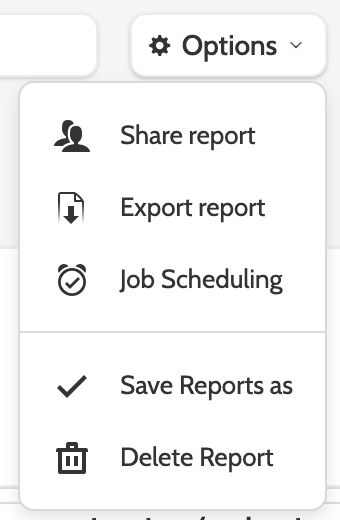
- Use the Options menu to:
- Share the report with other users
- Export it to Excel (or XLSX) format
- Schedule automatic delivery of reports via email (e.g. daily, weekly, or monthly) using the Job Scheduling feature.
Check it’s working
- When you open the report, you should see data grouped correctly (by project, campaign, team, agent, etc.)
- The KPIs you chose (or built) appear as columns with correct values
- Shared reports are accessible to intended users
- Exports or scheduled reports generate and deliver correctly
Troubleshooting essentials
- Data is missing? Check your filters — maybe the wrong project, campaign or team is selected
- A KPI shows zero or unexpected values? Verify that the underlying lead data or user activity is present, and that the custom KPI is built correctly (correct field, operator, filters)
- Scheduled reports are not delivered? Check email settings and job scheduling configuration
- Some users don’t see data? Ensure they have permission to access those projects/campaigns/users.
Last updated: 6/9/26, 1:21 PM